GPU Monitoring Dashboard

In this article, I'll guide everyone through creating a GPU monitoring dashboard with Grafana, starting from how to install Grafana all the way to configuring it to receive GPU performance metrics using dcgm-exporter through Prometheus until we can create a dashboard to view various GPU operations. We'll demo everything with Docker.
If everyone has prepared their machine, let's get started!
Create Docker Network
We'll have each container created in this example be on the same network so they can call each other through container names.
docker network create monitor
Install Grafana
Create a folder to store Grafana data and set permissions
mkdir grafana-data
chown -R 472:472 grafana-data
Run Grafana with Docker
docker run -d -p 3000:3000 --name=grafana --network monitor \
      -v "./grafana-data:/var/lib/grafana" \
      --user 472 \
      grafana/grafana-enterprise
We can access it via http://localhost:3000 with user: admin and password: admin. After that, set a new password.
Install DCGM Exporter
DCGM Exporter (short for Data Center GPU Manager Exporter) is a tool from NVIDIA used to extract GPU status information and export it in a format that can be easily used with monitoring systems like Prometheus.
Installation can be done by running through Docker.
docker run -itd --name dcgm-exporter \
--gpus all \
--runtime=nvidia \
--cap-add SYS_ADMIN \
--network monitor \
-p 9400:9400 nvcr.io/nvidia/k8s/dcgm-exporter:4.2.3-4.1.1-ubuntu22.04
The service is an API that returns GPU data. Test with:
curl http://localhost:9400/metrics
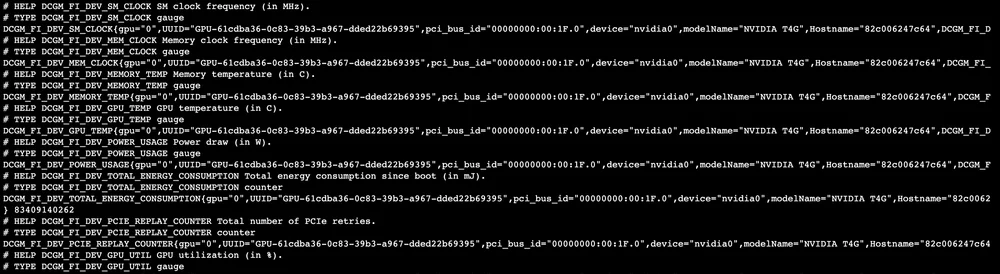
dcgm-exporter response
Install Prometheus
Create a folder to store configuration file
mkdir prometheus
Create prometheus.yml in the folder just created
global:
  scrape_interval:     15s # By default, scrape targets every 15 seconds.

  # Attach these labels to any time series or alerts when communicating with
  # external systems (federation, remote storage, Alertmanager).
  external_labels:
    monitor: 'codelab-monitor'

# A scrape configuration containing exactly one endpoint to scrape:
# Here it's Prometheus itself.
scrape_configs:
  # The job name is added as a label `job=<job_name>` to any timeseries scraped from this config.
  - job_name: 'prometheus'

    # Override the global default and scrape targets from this job every 5 seconds.
    scrape_interval: 5s
    static_configs:
      - targets: ['dcgm-exporter:9400']
Create Prometheus with Docker
docker run -itd \
--name=prometheus \
--network monitor \
-p 9090:9090 \
-v ./prometheus:/etc/prometheus \
--user root \
prom/prometheus
Configure Grafana Datasource
In the Grafana UI, go to Connections > Add new connection and select Data source as Prometheus
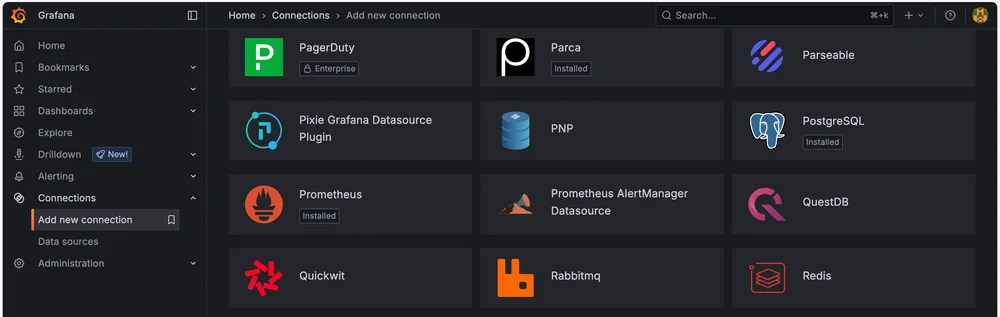
Then select Add new data source
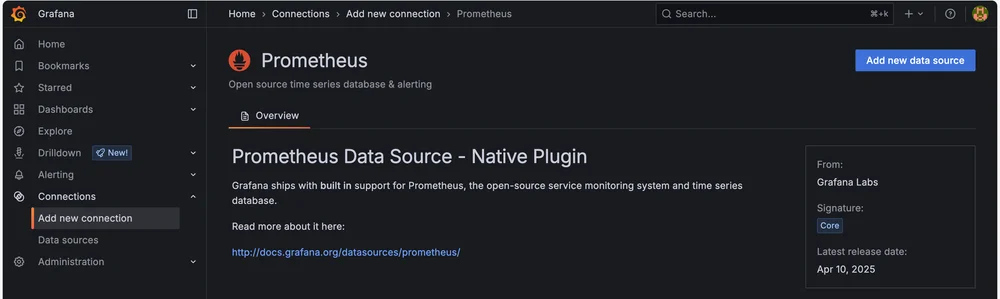
Once on the settings page, in Connection, enter the Prometheus server URL as http://prometheus:9090 then click save & test to create the data source.
Create Grafana Dashboard
In this step, we won't create the Dashboard ourselves but will use the template that Nvidia created from https://grafana.com/grafana/dashboards/12239-nvidia-dcgm-exporter-dashboard/
In Grafana, go to Dashboard, select Create Dashboard, then select Import dashboard
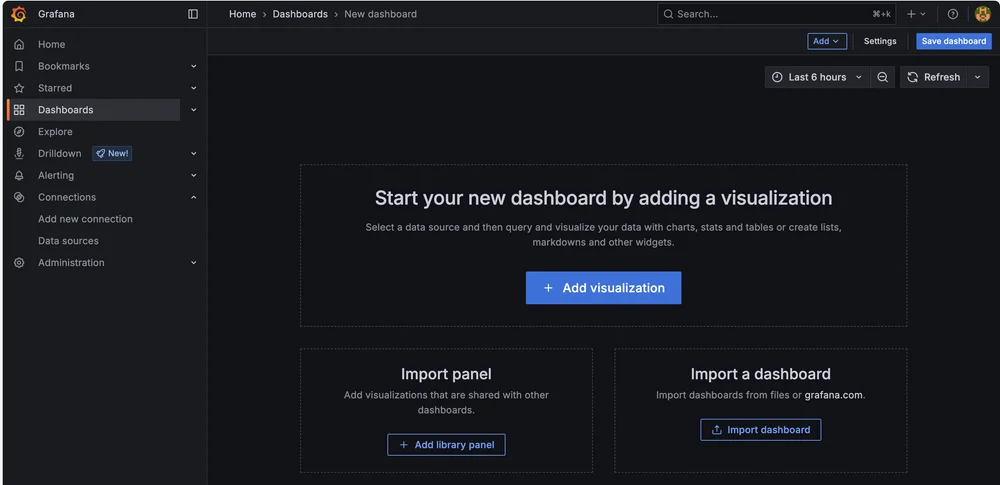
In the dashboard URL or ID field, enter 12239 which is the id of the nvidia dashboard, then click load and you'll arrive at the Import dashboard page
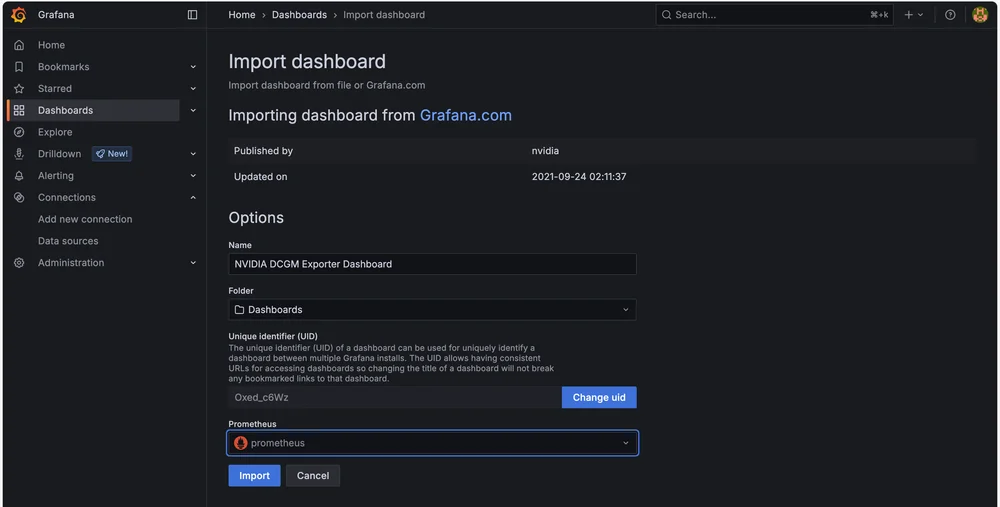
In the Prometheus field at the bottom, select the prometheus data source we created, then click Import
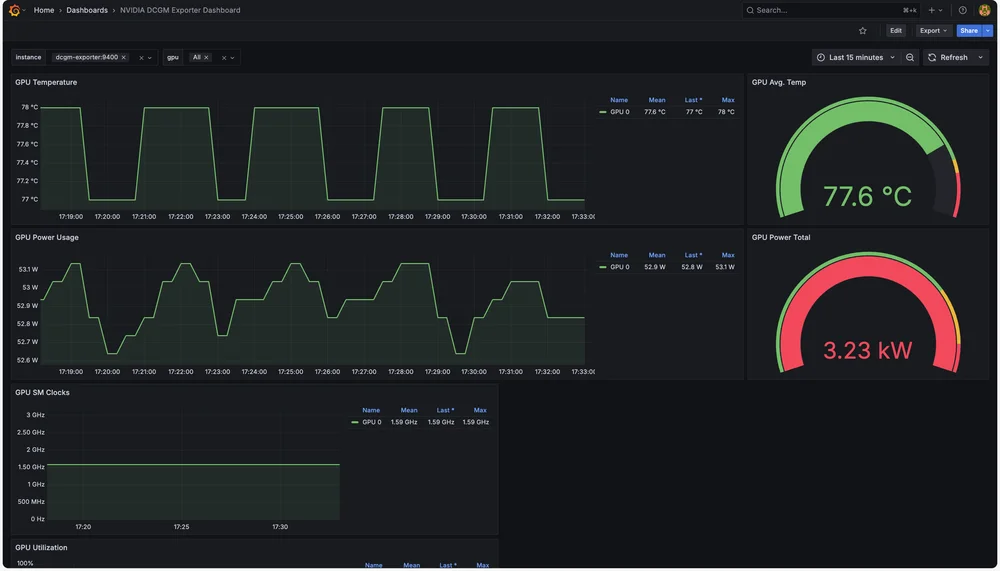
GPU Dashboard
And that's it! We now have a GPU Dashboard for monitoring various metrics.
Summary
This article is for those already using these tools - I believe you can easily adapt it to receive data from DCGM-Exporter. But for beginners, I believe you can follow these examples and use them successfully. Mainly, I just wanted to introduce the DCGM-Exporter tool which helps extract various GPU Metrics quite comprehensively, so it's a service I wanted to recommend for this purpose.